Energy Dashboard in Home Assistant
18th December 2025
The process for addition of an energy sensor channel as an Individual Devices Usage in the Energy Dashboard involves a few steps but not too arduous. This feature provides a way to get a break-down of what the energy Dashboard refers to as Untracked Consumption.
The first thing is to ensure that the power entity from the current sensor is defined with State Class and Device Class:
In the case where the power entity is not created in ESPHome you need to go to Customize.yaml and setup the definitions there:
sensor.solax_inverter_pv_power_1:
  unit_of_measurement: W
  friendly_name: Power Now DC 1
  state_class: measurement
  last_reset: '1970-01-01T00:00:00+00:00'
  device_class: power
Then the power entity (Watts or W) must be integrated to an energy entity (Watt-hours or Wh). This is just finding the area under the curve of a power vs time chart for a time interval.
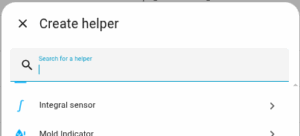
To do this go to Devices and Services in Settings and choose Helpers. The type of Helper needed is the Integral Sensor.
Add the desired entity and a name for the new energy entity being created:
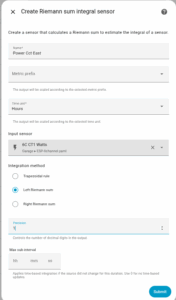
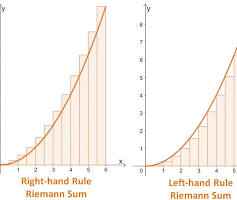
The Left Riemann Sum starts summing the data from the left edge giving better accuracy for what we are doing.
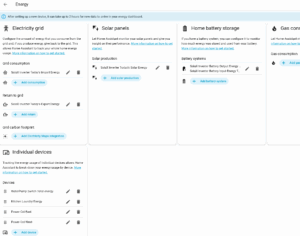
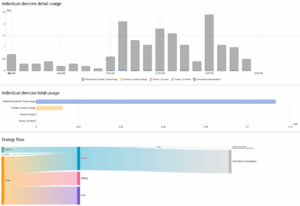
Next step is to go to Dashboard – Energy and edit the config. The Individual Devices section is at the bottom left.and add devices (entities) created in the previous step.
It will take some time to fully populate the Energy Dashboard but you will get a Sankey Diagram that shows the energy flow for the period as well as a stacked bar chart for the period.
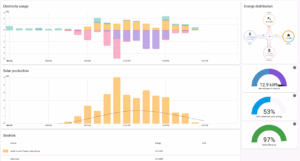
This all adds another dimension to your analysis of energy generated and consumed.
Hope you find this useful.
Rob B